Report data
The report data grid displays all the data that is available to components within a report. You can display the data grid for a report in two ways:
- From a report component, by editing a component, and then clicking Add Report Data on the Edit tab.
- From the report layout, by clicking Report Data.
The report data grid:
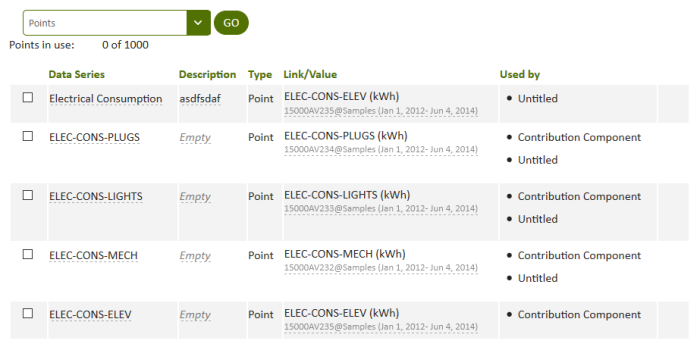
Figure: Report data series
A data series can be:
- Points — Raw data sourced from RC-Archive databases and spreadsheets.
- Data Sets — A collection of points that have been organized into a useful grouping of similar data.
- Number — Variables created within a report that can be used for reference.
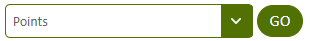
To select points to be added to a report, select Points and click Go to view the Manage Points page. When you have chosen one or more points in the Manage Points page, they appear in the report data grid.
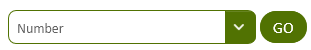
To designate a number (variable ) for use in the report, select Number and click Go. A new Number row appears in the report data list where you can define the number.
The report data grid contains the following columns:
Left Column
When accessed from a component's Add Report Data button on the Edit tab, use the check boxes in the left column to select the report data series to be added to the component as a component series. When viewed from the Report Data button of a report layout, this column lists row numbers rather than a check box.
Data Series
The Data Series column in a report's data grid displays the name of the data series. Click on a data series name to modify it. Any changes to a data series name applies to that data series throughout the report, including components.
Change the data series name so that report creators can recognize the purpose of the data series more easily. By default, data series derived from a point are named the same as the original point.
Description
The Description column in a report's data grid can be used to display a user-friendly description of the data series. Click on a cell in the Description column to include more details about the data series.
Type
The Type column in a report's data grid displays the type of data series: Point or Number.
Points are sourced from the points list. For more information about points, see The Manage Points page. Numbers are report variables used by the Number Editor component. For more information about the Number Editor component, see Number Editor component.
Link/Value
The Link/Value column in a report's data grid displays the name of the linked point or value of the Number (report variable).
- Linked point — When you click a linked point, the Choose Point list appears. You can reassign the linked data series to a new point by selecting the point in the Manage Points list and clicking OK. The reassigned point will appear in the Link/Value column for the data series.
- Number — When you click on a number row, the box becomes editable. Enter a default value for the Number. Numbers are report variables used by the Number Editor component. For more information about the Number Editor component, see Number Editor component.
Used By
The Used By column in a report's data grid shows the components in the current report that use a data series. Multiple components in the same report can use the same report data series.
Right Column
For numbers or data series that can be deleted, this column displays a Delete ![]() icon. Click the Delete icon to delete the data series. The linked point is not affected, it is only removed from the report. Only numbers and points that are not currently being used by a component can be deleted. To delete a data point, first remove it from use by all the components in the current report.
icon. Click the Delete icon to delete the data series. The linked point is not affected, it is only removed from the report. Only numbers and points that are not currently being used by a component can be deleted. To delete a data point, first remove it from use by all the components in the current report.
Note: If you create a data series that uses a point that is already designated as a data series for the report, it will appear in red. A message dialog box will appear warning that duplicate names will corrupt the report.
© 2019 Reliable Controls Corporation. All rights reserved. Published October 29, 2019