Periodic component
![]()
Use the Periodic component to compare trends over current and previous time periods expressed in years, months, days, or weeks. The Periodic component provides an effective way to identify performance trends and any anomalies when comparing similar time ranges.
Periodic component chart
The following chart is configured to compare yearly electrical consumption for the previous 4 years. To do this, the periodic configuration specifies a periodic length of Calendar Year, a period ending date of 1 Calendar years before today for a relative date range, and a sampling setting of Monthly. See Configuring the Periodic component for further information about the configuration options.
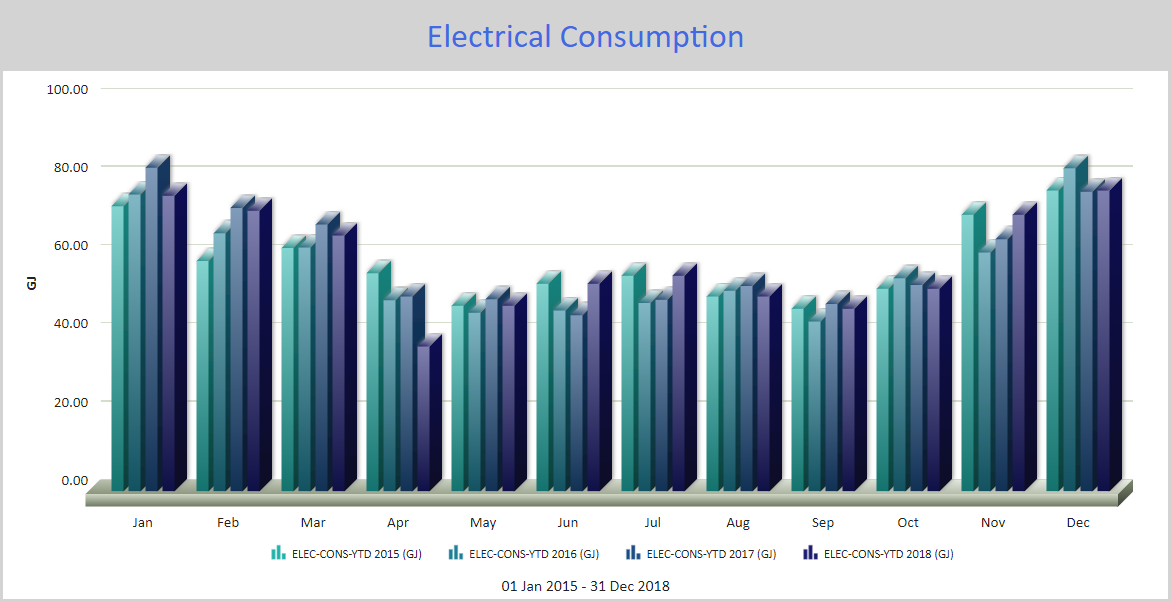
Figure: Periodic component chart example with Calendar years specified as the Period Ending date
The following chart is configured to compare yearly electrical consumption for the current and previous 3 years. In this example the period ending date setting is different. It is set to 0 Years before today for the relative date range.
As a result, the data for each month except the current month (October) is for the full month for each of the years. For the current month, the data is compared for the same relative date for each of the previous years to the current date in the current year. That is, if today's date is October 16, the data shown for October for the previous 3 years is up to October 16. As the current date progresses, the data for October for each year is updated to show the values related to the current date.
See Configuring the Periodic component for further information about the configuration options.
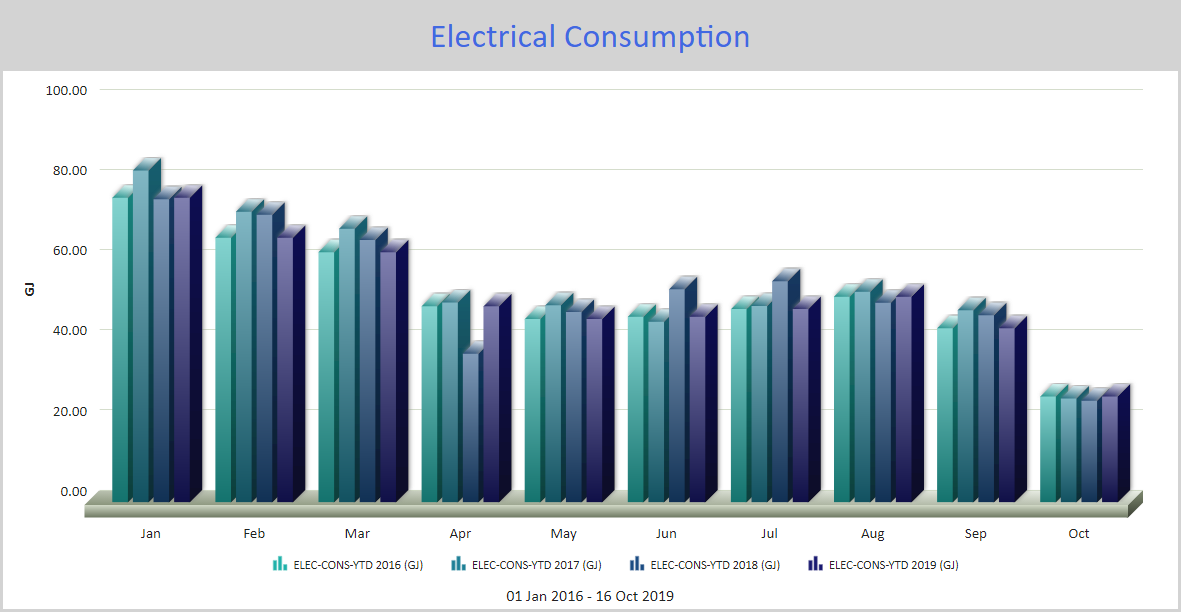
Figure: Periodic component chart example with Years specified as the Period Ending date
When viewing a Periodic component online, you can:
- Hover over columns to view a flyout that contains the column value.
- If a legend is included, click a data series name in the legend to view or hide the related column in the chart.
Use the following steps to create a Periodic component:
-
Click the Periodic component in the list on the right to add it to the canvas.
— or —
Click and drag the Periodic component from the vertical list to a specific location on the report canvas.
- Click Edit
 in the component's banner or use the Click to edit link to open the Edit Periodic Component dialog box.
 -
Click Add Report Data, select a data series, and click OK to add it to the Edit Periodic Component dialog box.
The default options are Column as the chart type for the data series, Display chart legend to include the legend in the chart, Delta for the query function, and Periodic in the Dates column.
The Periodic setting in the Dates column indicates that the data series is controlled by the settings in the Periodic Configuration area in the Edit Periodic Component dialog box. See Configuring the Periodic component for more information.
© 2019 Reliable Controls Corporation. All rights reserved. Published October 29, 2019