Report Data and Edit Component dialog boxes
When you open the Report Data dialog box, you can open additional dialog boxes from which to select data points or Data Sets to add to the component. Select Points or Data Sets in the filter list and click Go to open the Choose Points dialog box or the Choose Data Sets dialog box, respectively.
The following diagram represents the dialog boxes you use to add point data to a chart component and how they relate to the report in which the chart component appears.
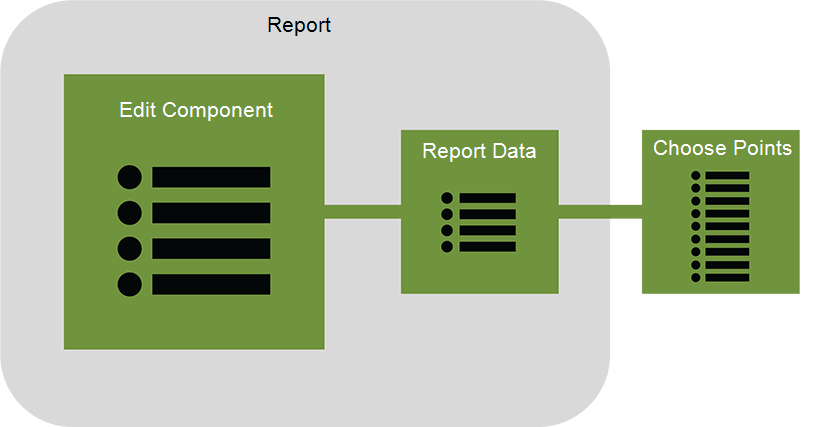
Figure: Data used in a report
The following steps describe how to add data to a chart component using these dialog boxes.
Step One: Review Component Data
The first step in working with a component is to review the component's list of data. To view the data in a component, click the component's Edit ![]() icon and click Edit in the menu. The Edit Component dialog box appears.
icon and click Edit in the menu. The Edit Component dialog box appears.
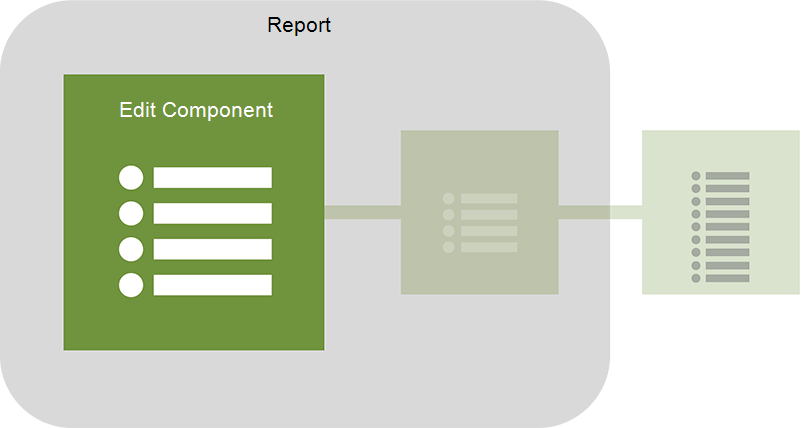
Figure: Step One - Review component data
If the component is new, the Edit tab in the Edit Component dialog box is empty until data is added. If data already exists for the component, the Edit Component dialog box lists the data.
See Component data for more information.
Step Two: Review Report Data
If the data listed on the Edit Component dialog box's Edit tab is not sufficient for what you need to chart, click Add Report Data. The Report Data dialog box appears, showing the report data available in the report. If the report is new and does not yet contain data, the Report Data dialog box is empty. If the report already contains data, it displays in the grid on the Report Data dialog box.
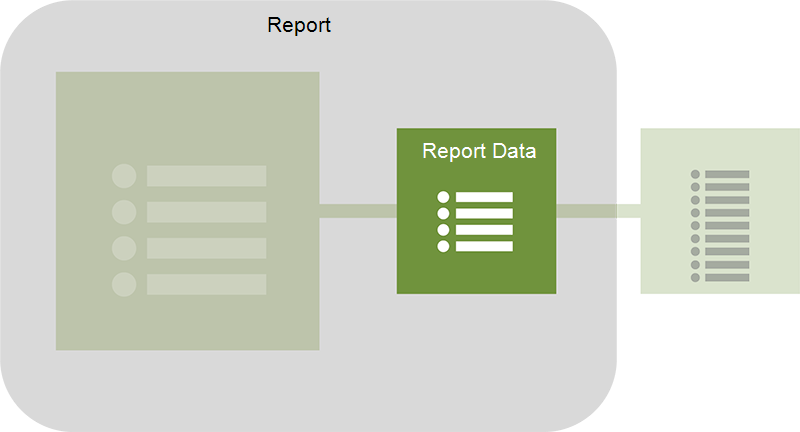
Figure: Step two - Review report data
For more information about the report data dialog box, see Report data.
Step Three: Add Data to Your Report
To add data to a component, the data must first be available in the report. To add data to a report, use the Choose Points or the Choose Data Set dialog box.
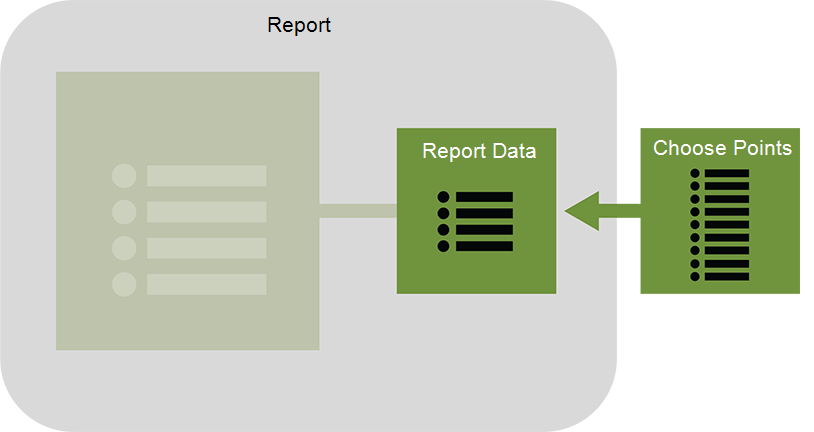
Figure: Step three - Add data to the report data grid
To view the Choose Points or Choose Data Set dialog box, select the appropriate entry in the drop-down box above the report data grid in the Report Data dialog box. Click Go.

Figure: Drop-down box selection for adding points to your report
In the grid area of the Choose Points or Choose Data Sets dialog box, select check boxes in the left-hand column to add the corresponding points to your report. Once you have finished selecting points or Data Sets for your component, click OK. The Report Data dialog box re-appears, showing the newly-added data in the report data grid.
Step Four: Add Number Data Types to Your Report
If your report does not contain Number data types that let you modify the data displayed in your report, add them by selecting Number in the drop-down list on the Report Data dialog box, and then clicking Go.
Figure: Drop-down box selection for adding Numbers to your report
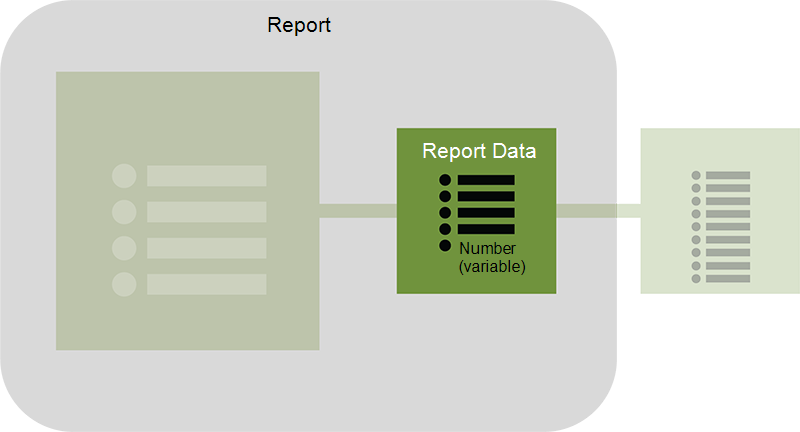
Figure: Step four- Add Numbers (variables) to a report data grid
The Number data type is added to your report data grid. For more information about Numbers, see Number Editor component.
Step Five: Add Report Data to Your Chart Component
Review the data in the report data grid. Add report data to your component by selecting the box for the appropriate row in the left-hand column and then clicking OK. 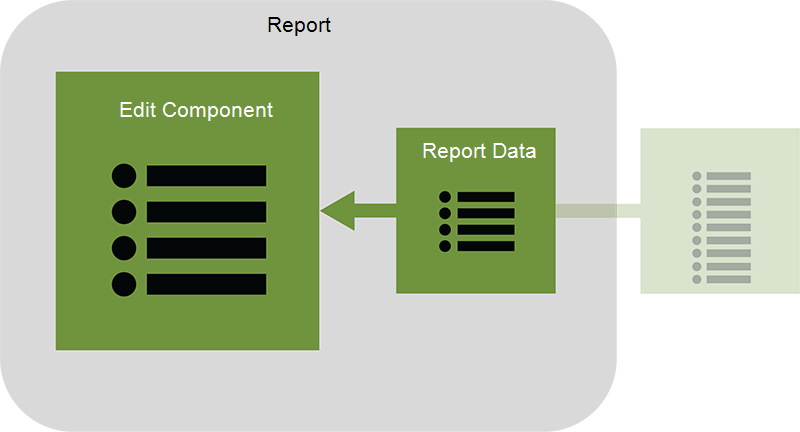
Figure: Step five - Add report data to the chart component
The Edit Component dialog box refreshes to show the newly-added data in the component data grid.
Step Six: Add Queries to Your Chart Component
Once you have added the necessary data to your component, you can further refine your component data by applying a query functionality to each data series.
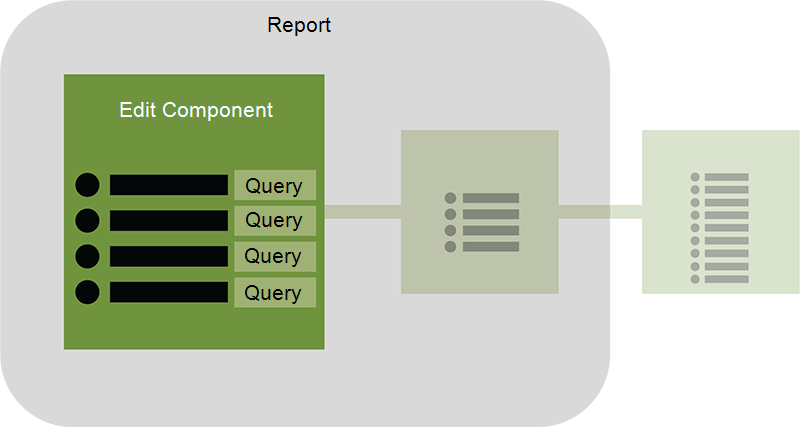
Figure: Step six - Add queries to the component data
In a component data grid, click in the Query column to display the query editor. In the query editor, select items from the drop-down lists to build your query formula. For more information about queries, see Query.
You can continue working with your chart component by choosing a chart type, adding queries, and refining presentation details as described in Component data.
© 2019 Reliable Controls Corporation. All rights reserved. Published October 29, 2019