Configuring the Periodic component
The Periodic Configuration area in the Edit Periodic Component dialog box needs to be completed for a data series with Periodic specified in the Dates column. This area contains the following options:
Period Length
The maximum range of time used for analysis. The default is Calendar Year. The combination of the settings for Period Length and Period End define the total range of time for each period. Depending on the end date for the period, the range of time may be shortened. The values are:
- Calendar Year — Up to a calendar year.
- Calendar Month — Up to a calendar month.
- Week — Up to 7 days.
- Day — Exactly one day.
Period End
Defines the end date for the most recent period and is used to define the total length of the period, which is used for all other calculated periods.
For example, with Period Length set to Calendar Year and Period End set to June 30, the period range is January 1 to June 30 for the most recent period. All other periods for previous years are also from January 1 to June 30.
The default for the end date is Relative. The choices are:
-
Available — The end date for all of the available data, beginning with the last date that data is available and including data for the specified number of periods.
For example, if data is available from 2014 through 2019, and the value specified for Number of Periods is 3, then the data included in the component is from 2017 through 2019.
- Report Dates — The last day for the end date specified in the Configure Report Dates dialog box.
- Specific — A fixed end date for the period's data.
- Relative — The end date for the period relative to the current date. See Significance of the Relative setting.
The default for the period end setting is 0 Calendar years before today. The options for period end settings are as follows:
| Available | Relative | Report Dates | Specific |
|---|---|---|---|
| The available dates for the data. |
The choice of settings are:
|
The last day specified in the Configure Reports Dates dialog box. | The month, day, and year selected in the date picker. |
Sampling
The frequency of the sampling interval. The default is Monthly. The options available for the sampling period are determined by the value for Period Length and must be equal to or less than the value selected for Period Length. The values are:
- Yearly — On December 31
- Monthly — At the last day of the month.
- Weekly — Every 7th day.
- Daily — At the end-of-day at midnight.
- Hourly — An hourly sample on the hour.
Period Frequency
Defines how often the period repeats. The default is Yearly. Period Frequency must be equal to or greater than Period Length. The values are:
- Yearly — A period and the adjacent period are one year apart.
- Monthly — A period and the adjacent period are one month apart.
- Weekly — A period and the adjacent period are one week apart.
- Daily — A period and the adjacent period are one day apart.
Number of Periods
The number of periods to include on the chart. The default value is 4. To show three years of data, set the value to 3. The minimum value is 1.
Significance of the Relative setting
The Relative setting for the Period End option determines the date or time before today that the period ends. Following is a summary of examples indicating the effect of the settings on the charting of the data series:
| Before today | Period ends |
|---|---|
| 0 Calendar years | December 31 of the current year |
| 0 Days, Weeks, Calendar Weeks, Months, Calendar Months, Years | Today |
| 1 Day | Yesterday |
| 1 Week | 7 days before today. If Period Length is Calendar Year, a week is a multiple of 7 days from January 1. |
| 1 Calendar Week | End of day Saturday |
| 1 Month | The same day of the previous month |
| 1 Calendar Month | The last day of the previous month |
| 1 Year | The same day last year |
| 1 Calendar Year | December 31 of the previous year |
Relationship of Period Length, Sampling, and Frequency options
Each Period Length option affects the availability of the Sampling and Period Frequency options. The combinations are as follows:
| Period Length | Available Sampling options (equal to or less than Period Length) |
Available Period Frequency options (equal to or greater than Period Length) |
|---|---|---|
| Calendar Year | Yearly, Monthly, Weekly, Daily | Year |
| Calendar Month | Monthly, Daily | Year, Month |
| Week | Weekly, Daily | Year, Month, Week |
| Day | Daily, Hourly | Year, Month, Week, Day |
The color selector allows you to control the appearance of the data series displayed in the Periodic component. It allows you to select a color for the oldest period in the series, the newest period in the series, and the color model to use for any series between the oldest period and the newest period.
To specify the colors for the data series:
- Add a data series to the Periodic component.
-
Click the color square to the left of the data series to open the color selector.
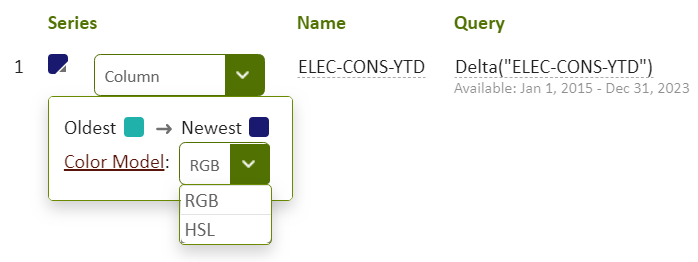
Figure: Color selector showing color selections and color models
- Click the color square beside Oldest and select a color in the color picker, and do the same for the color for Newest.
-
Click the dropdown arrow for the Color Model and select RGB or HSL for the color representation.
RGB (Red Green Blue) provides smaller differences in the interpolated colors compared to HSL (Hue Saturation Lightness). Since each model represents colors differently, you can select the color model that provides the best color interpolation for your purposes.
For further information, review the articles describing the RGB and HSL color models on the Internet.
- Click OK to close the Edit Periodic component dialog box and to view the results in the report.
Non-periodic data series in the Periodic component
You can add another data series to a Periodic component but you have the option of excluding it from the periodic configuration. For example, you can chart target data to compare current building performance to an established target. In addition to using non-periodic data to show targets in the charted data, if the data fits with the periodic configuration, you can also use it for comparison across all period results.To disassociate the data series from the periodic configuration, select Specific or Relative in the Dates column for the data series.
Although you can use several data series in the Periodic component, you must use one of the data series for the periodic configuration. That is, you need to set the entry in the Dates column in the Edit Periodic Component dialog box to Periodic for one of the data series. You can then decide whether or not to configure the remaining data series as periodic.
All data in the time range specified for a non-periodic data series will be assessed for its ability to fit on the chart defined by the periodic configuration area for the component and split into multiple series accordingly. If the time range specified for a non-periodic data series does not fit within the output of the periodic configuration, it will not be displayed on the chart.
© 2019 Reliable Controls Corporation. All rights reserved. Published October 29, 2019